Skip to Content
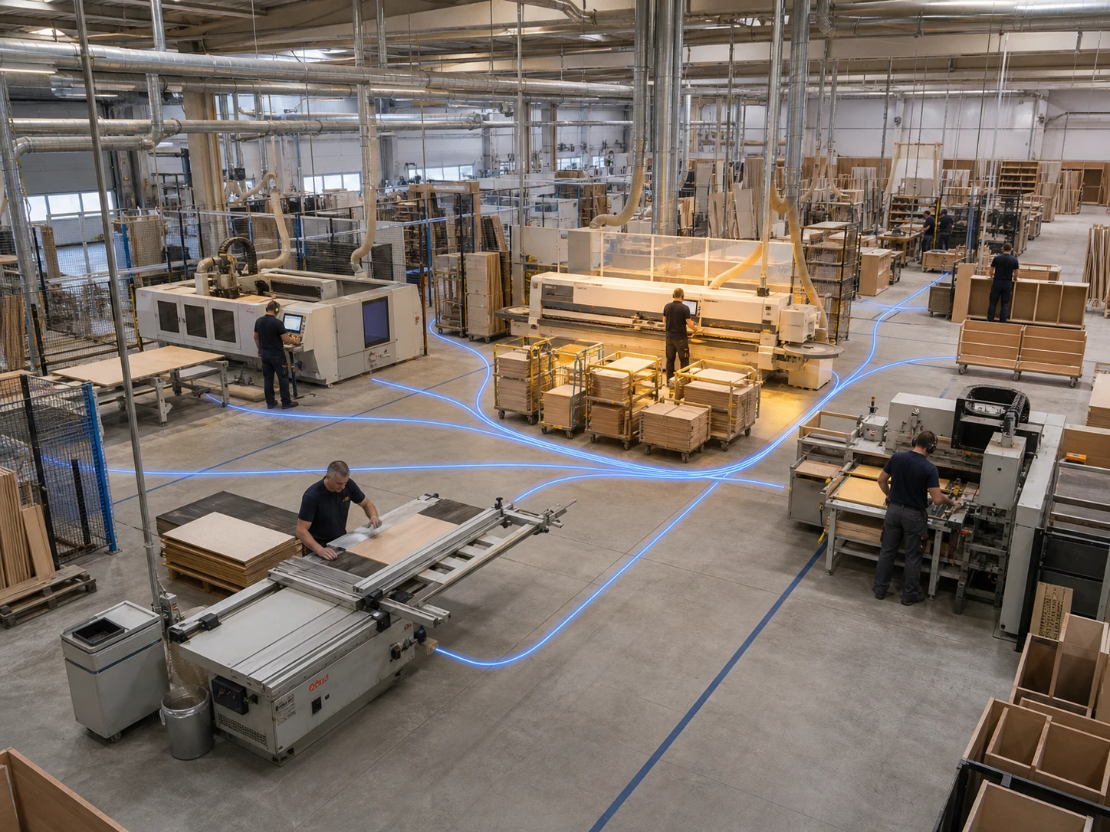
Conceptual production flow visualisation

Production data solutions

Production data should reveal the next action.

Lean2SFor managing the continuous improvement cycle.

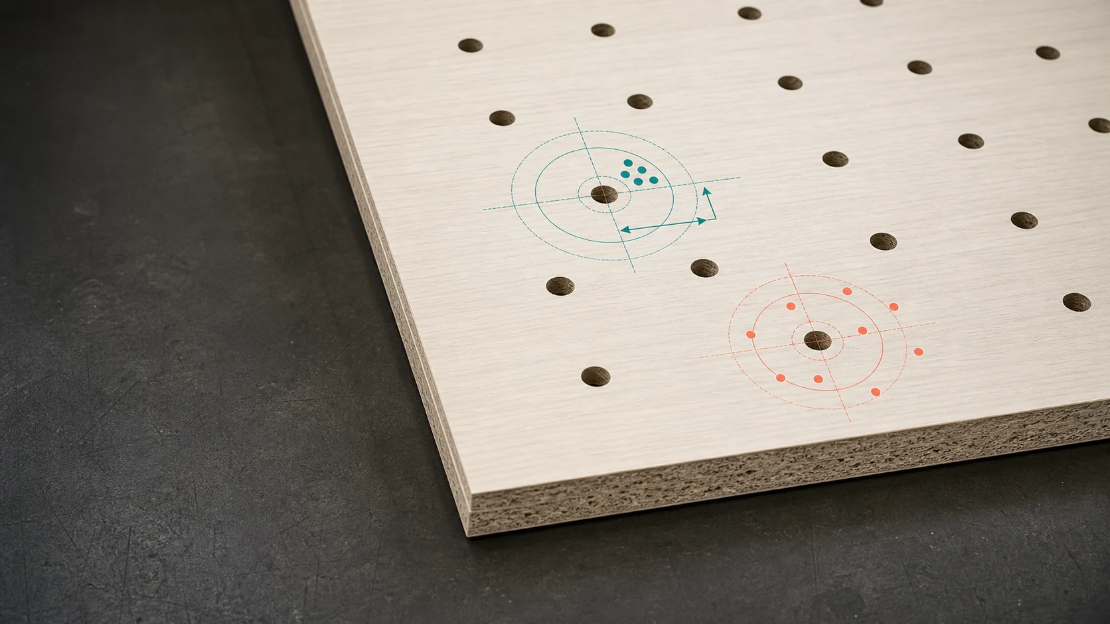
Lean2S DrillAssistFor precise drilling line setup and early identification of unstable units.

Proven in real productionData is used for daily decisions, not just reporting.
Since 2000manufacturing IT and flow experience
Works independentlyERP and Power BI are optional
LT · LV · EE · UA · ITcountries where Lean2S is in use

Two Lean2S products

Choose based on the manufacturing task you need to solve.

Lean2S and Lean2S DrillAssist can be used separately or together when a specific situation needs both solutions.

Lean2S cycle

Data matters only when it turns into profitable action.

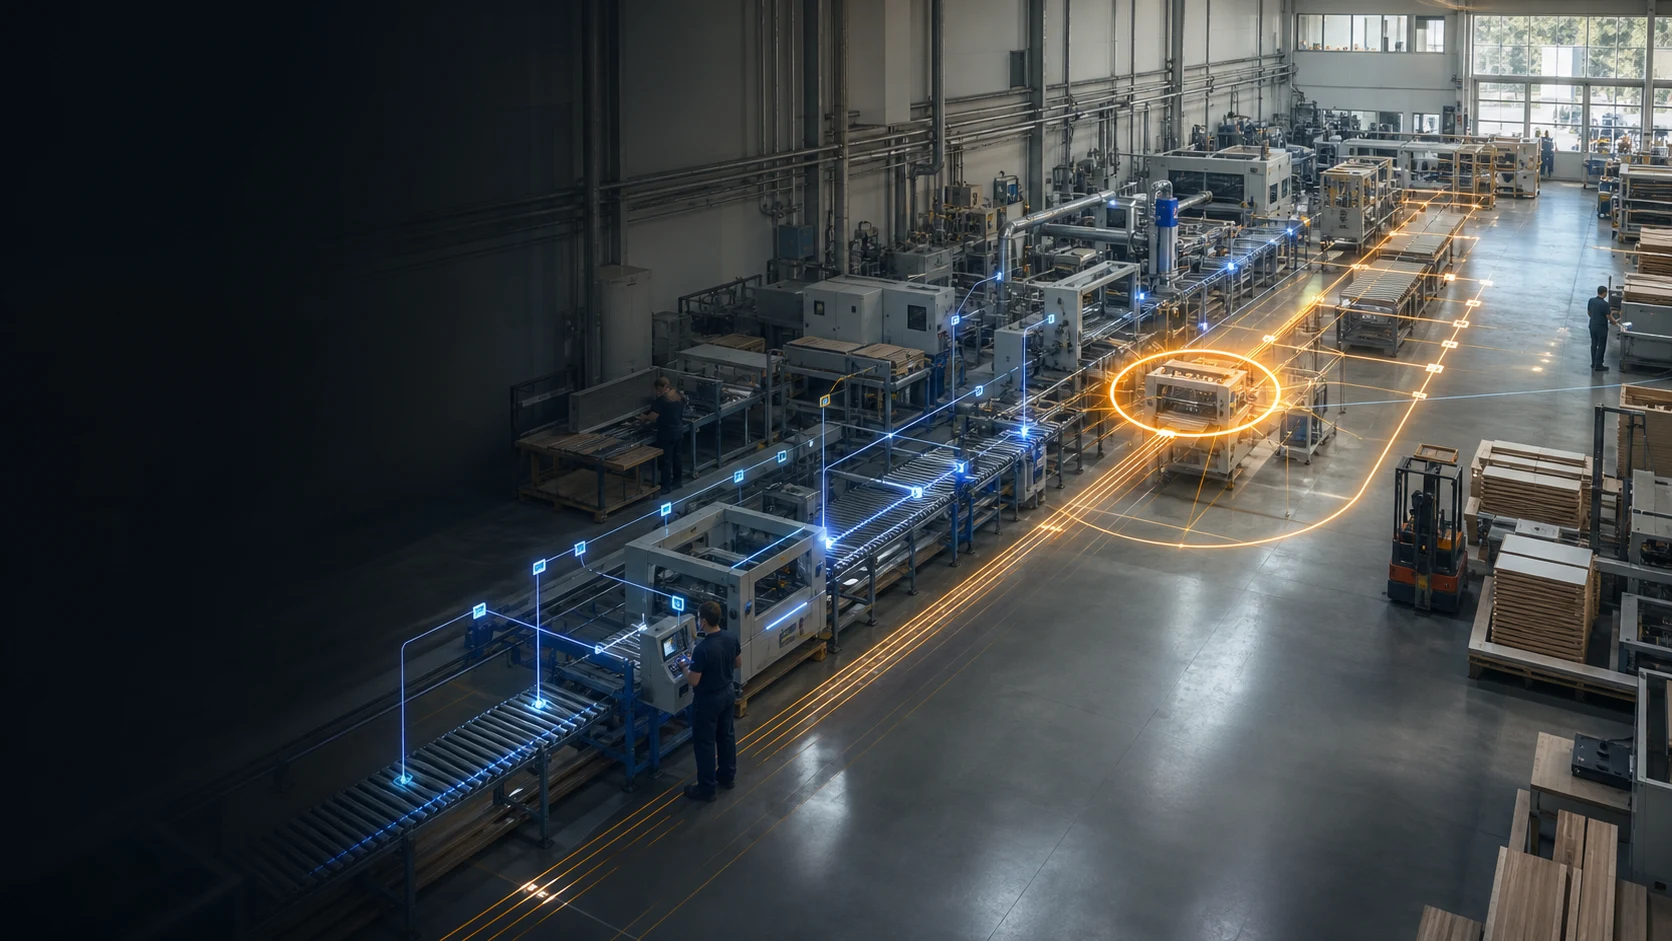
The system connects a production fact, its cause, ownership and impact verification.

01

Data

Equipment signals and shift information.
02

Clarity

Flow, downtime and the constraint.

03

Causes

Recurrence and highest impact.

04

Actions

Ownership, deadline and PDCA.

05

Improvement

Before-and-after comparison.

Recorded experience

Data showed the direction, while each company chose the changes.

After the first week of data collection, Proginta delivered a 1.5-hour data-reading session and proposed possible causes. Each company's management team then assessed the shop-floor situation, made decisions and implemented changes.

+36%Furniture industry
+30%Food industry
+27%Metalworking

This is experience recorded in Proginta projects, not a guaranteed outcome for every implementation.

Lean2S modules

From an equipment signal to a measured improvement.

Inside Lean2S, the team works with data, downtime, tasks, responses and improvement actions. External systems are connected only when they are genuinely needed.

Daily work and improvement modules
Machine detailMinute-by-minute equipment data.
Downtime causesCause capture, grouping and recurrence analysis.
Production tasksTask recording and execution context.
Action moduleKaizen, PDCA, quality or other data-collection tasks.
AndonAssistance or material calls and response time.
AnalyticsReports, Pareto, OEE, Availability and flow metrics.
OperatorsOperator work, shifts and responsibilities.
TV screensProduction status on shop-floor screens.
Push notificationsProactive signals to responsible people.

External connections when needed

ERPBusiness data context
Power BIExceptional analysis with other systems
SaaSThird-party SaaS integrations

See what is actually limiting your production flow.

Book a demo