Data
Automatic signals, quantities and shift context.
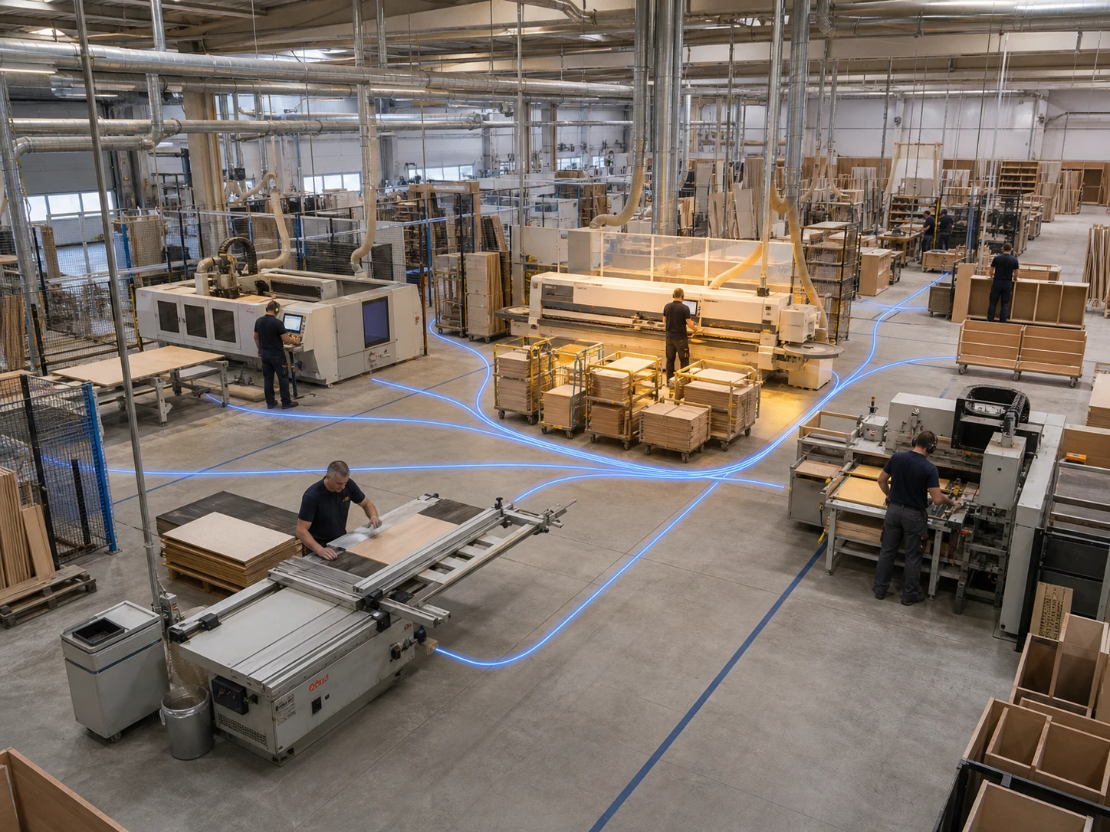
Continuous improvement platform for manufacturing
Equipment data, shift reports, Andon, Kaizen and PDCA in one manufacturing workspace.
More than monitoring
Lean2S automatically captures equipment run time and downtime, records causes, displays Pareto analysis and helps identify the machine limiting flow. Andon, Kaizen and PDCA tools turn data into team action.
Improvement cycle
Lean2S connects the production fact, the response, the improvement action and verification of its impact.
Automatic signals, quantities and shift context.
Downtime, causes and the flow constraint.
An Andon signal and a shift-level decision.
A Kaizen or PDCA action, owner and deadline.
A before-and-after comparison of the implemented change.
Lean2S tools
Run time, downtime, quantities, speed and flow metrics.
Assistance or material supply calls, task acceptance, completion and response-time measurement.
Ideas, agreed actions, ownership, deadlines and result verification before and after a change.
Lean2S modules
Inside Lean2S, the team works with data, downtime, tasks, responses and improvement actions. External systems are connected only when they are genuinely needed.
How we start
The goal is to test the assumption with data, show the team how to read it and only then decide whether to expand to other equipment.
We begin with the place managers suspect is limiting production flow.
For about a week, run time, downtime, output and shift data are collected.
In a 1.5-hour session, recurring patterns and possible causes are reviewed.
Production managers review the shop-floor situation and decide what to change.
Results are compared before and after the change, then expansion is considered.
Frequently asked questions
Lean2S is a continuous improvement system for manufacturing. It collects equipment data, reveals downtime causes, supports shift response and links improvement actions with measured results.
No. Lean2S works independently: core data, reports, loss evaluation and improvement actions are handled inside Lean2S. ERP, Power BI or other systems can be connected only when additional context is needed.
Automated lines, individual machines and manual workstations where a reliable motion, current, pressure, pulse, speed or counter signal can be obtained.
We recommend starting with the machine the company believes may be limiting production flow. This quickly tests the assumption, helps the team learn to read the data and only then supports a decision on expanding monitoring to other equipment.
Outcomes depend on the production situation and the actions chosen by the company. Across three Proginta projects, output per hour increased by 27–36% over 2–3 months without an increase in the defect rate. This is recorded experience, not a guaranteed result for every implementation.